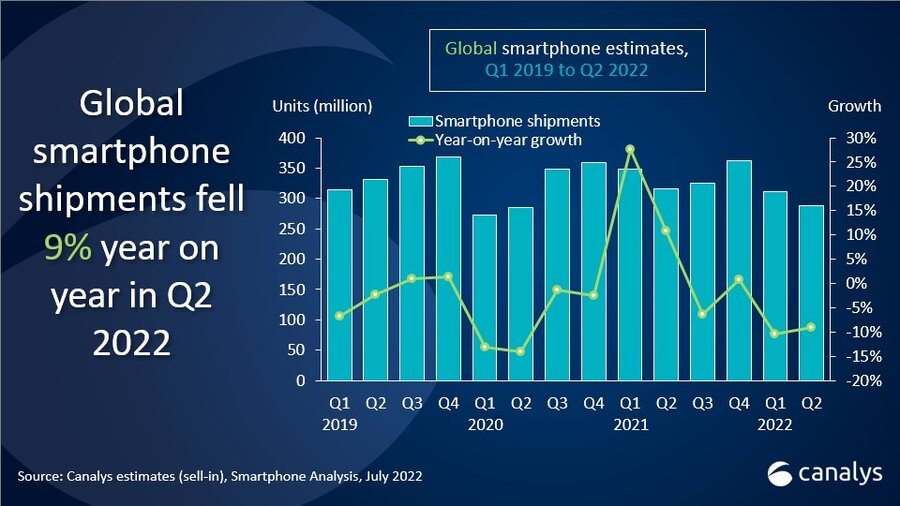
Global smartphone shipments fell to 287 million units in Q2 2022, the lowest quarterly figure since Q2 2020, when the pandemic first hit, according to the latest report from Canalys.
Samsung led the market with 61.8 million smartphones shipped and a 21% market share. Despite the weak seasonality, Apple held on to second place, shipping 49.5 million iPhones for a 17% market share. Xiaomi stayed in third place with 39.6 million units, while OPPO and vivo completed the top five with 27.3 and 25.4 million units, respectively.
“The global smartphone market is suffering a second period of falling shipments after a brief recovery in 2021, and the sudden drop in demand is hitting the leading vendors,” said Canalys Research Analyst Runar Bjørhovde. “Despite 6% annual growth, Samsung’s shipments fell 16% on the previous quarter as the vendor struggled with unhealthy inventory levels, especially in the mid-range. Samsung is pushing aggressive pricing strategies and heavy promotions for its low-end A series, leveraging the cost-effective ODM production to stimulate consumer demand in the mass market. In the premium segment, Samsung stressed its focus on foldable phones and the S series as profit drivers in developed markets. Meanwhile, solid demand for the iPhone 13 series in North America, China and Europe enabled Apple to grow despite the headwinds. The high end has proven relatively resilient during the recession, while promotions and financing options have helped with affordability.”
“The major Chinese vendors managed to stabilize their worldwide performance compared with last quarter despite another round of double-digit year-on-year contractions,” said Toby Zhu, Canalys Analyst. “We have seen the top Chinese players focus on very different strategic priorities during the downturn. Xiaomi is ambitious to expand its high-end portfolio in China through its latest partnership with Leica, with new products hitting the market in Q3. It has also been adjusting product upgrade cycles to speed up launches in the mass market, leveraging its supply chain capabilities. OPPO managed a steady performance in Europe in Q2, with a year-on-year market share increase, thanks to its significant investment in sponsorships and, more recently, driving sustainability awareness, which has helped to raise its brand profile. On the other hand, vivo is adopting a highly cautious yet consistent expansion strategy, with a particular focus on building in-house hardware differentiation, such as ISP chips and cameras. In Q2, the vendor grew steadily in Latin America while recovering its market position in the highly competitive APAC market.”
 Supply chain shortages are no longer the most pressing issue as component orders are being cut rapidly and suppliers have started to be concerned about oversupply,” said Zhu. “It has resulted in price cuts for key components, which reduces costs for vendors. Vendors could use the extra savings to improve the product competitiveness of new launches in the second half of the year. At the same time, that might make getting rid of old models even harder. The oversupply situation is demanding more of vendors’ planning capabilities than the shortage period.”
“There will be increasing tensions throughout the entire smartphone supply chain as demand weakness will likely continue for an extended period,” said Zhu. “The market is experiencing exceptionally challenging business conditions. Vendors should improve transparency when working with component suppliers and channel partners in the following quarters. Geopolitical issues, a dip in consumer confidence and high inflation will continue to damage future market performance, despite upcoming new launches and festival sales in the second half of 2022.”
|
Worldwide smartphone shipments and annual growth Canalys Smartphone Market Pulse: Q2 2022 |
|||||
|
Vendor |
Q2 2022 |
Q2 2022 |
Q2 2021 |
Q2 2021 |
Annual |
|
Samsung |
61.8 |
21% |
58.0 |
18% |
6% |
|
Apple |
49.5 |
17% |
45.7 |
14% |
8% |
|
Xiaomi |
39.6 |
14% |
52.8 |
17% |
-25% |
|
OPPO |
27.3 |
10% |
34.9 |
11% |
-22% |
|
vivo |
25.4 |
9% |
31.2 |
10% |
-19% |
|
Others |
83.9 |
29% |
93.0 |
29% |
-10% |
|
Total |
287.4 |
100% |
315.6 |
100% |
-9% |
|
|
|
|
|||
|
Note: percentages may not add up to 100% due to rounding |
|||||


